Convection - Experiments
Turbulent Rayleigh–Bénard convection and the ultimate-state transition
Well past the onset of turbulence and up to Ra ≈ 1011 basically all experiments and numerical simulations reveal a similar Nu(Ra) scaling amongst one another. In this regime the bulk has transitioned into turbulence but the viscous and thermal boundary layers (BLs) are still of a laminar Prandtl-Blasius type [1]. Here, the heat transport is limited by the thermal and viscous diffusivities of the BLs. This is regarded as the 'classical' state.
As originally predicted by Kraichnan [2] a transition should happen at large Ra where the BLs will also have transferred into turbulence due to the increasing amount of shear induced by either the large-scale circulation or the turbulent fluctuations inside of the bulk [1]. This state is regarded as the 'ultimate' or 'Kraichnan' state: The heat transport is no longer dominated by the BLs but by the convection occurring inside of the bulk. The Nu(Ra) scaling in the ultimate regime is predicted to reach an asymptotic dependence Nu ∝ Ra1/2 times logarithmic corrections due to viscous sublayers [1, 2].
Understanding the ultimate state is relevant in order to validate the extrapolation of laboratory measurements to geo-/astrophysically relevant ranges. Interestingly, in the regime Ra > 1011 many experiments reveal very different Nu(Ra) scalings and different Ra numbers where a transition takes place [1]. To elucidate this we performed experiments on the High Pressure Convection Facility (HPCF) at the MPIDS.
The facility comprises a general purpose pressure vessel, known as the Göttingen "U-Boot", that can be filled with sulfur hexafluoride (SF6) at pressures up to 19 bars with a near constant Prandtl number of Pr ∼ 0.8. The vessel can house two different RBC cells alongside each other. They have aspect ratios Γ ≡ D/L = 1.00 and Γ = 0.50, both with a diameter D = 1.12 m and with a length of, respectively, L = 1.12 and L = 2.24 m. The maximum Rayleigh numbers that were achieved with these cells at near Oberbeck-Boussinesq conditions [3] are, respectively, Ra ≈ 2×10¹⁴ and Ra ≈ 1015. Detailed information on the U-Boot and the RBC cells can be found in [4, 5, 6].
Global heat transport
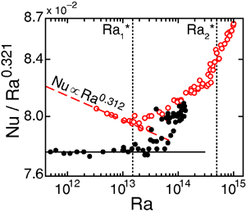
We focus on the global Nu(Ra) scaling and define a local effective exponent, Nu ∝ Raγeff. For Γ = 0.50, we reported γeff = 0.312 ± 0.002 in the classical range at Ra ≤ Ra*1 ≃ 1.5×10¹³ (see figure 1 and [4, 7]). Likewise for Γ = 1.00 in the classical range we found γeff = 0.321 ± 0.002 [5]. These scaling exponents are close to one other, are slightly dependent upon the aspect ratio and are in good agreement with other experiments, direct numerical simulations and the Grossmann and Lohse model [1]. Remarkably, a transition sets in for both cells above a nearly identical value Ra ≳ Ra*1, viz. γeff starts to increase. For Γ = 0.50 we were able to increase Ra well enough to recover a new, well-defined local scaling exponent, γeff ≈ 0.38 at Ra ≥ Ra*2 ≃ 5×10¹⁴. This effective exponent is not only predicted as the ultimate-state scaling for the investigated control parameters, but the Ra number at which the ultimate-state transition should occur also matches [1, 2]. This convinces us that we have successfully entered the ultimate state of RBC in the lab. The range Ra*1 < Ra < Ra*2 appears to be a transitional range from the classical state towards the ultimate state. The transitions found by us are, within the resolution of the data, independent of Γ. We believe that a Γ-independent Ra*1 suggests that the BL shear-transition is induced by fluctuations on a scale less than the sample dimensions rather than by a global Γ-dependent flow mode. Above Ra*1, any difference between the heat transport for the two Γ values is too small to be resolved, suggesting a universal aspect of the ultimate-state transition and properties [5].
Global and local measurements on a Γ = 0.33 cell at up to Ra = 4×10¹⁵ are underway, which should allow us to probe deeper into the ultimate regime.

|
Figure 1: Transition to the ultimate state of RBC. The heat transport, Nu, compensated for by Ra0.321, plotted against the non-dimensional temperature difference, Ra. Data of the Γ = 0.50 cell are indicated by the open red circles, the Γ = 1.00 cell by the closed black circles. At Ra ≤ Ra*1 ≃ 1.5×10¹³, both cells are in the classical state with an effective exponent of γeff ≈ 0.32 that is slightly dependent on the aspect ratio. For both cells, a transition sets in at Ra ≈ Ra*1, which for the Γ = 0.50 cell at Ra ≥ Ra*2 ≃ 5×10¹⁴ eventually results in an effective exponent of γeff ≈ 0.38, predicted by [1] to be inherent to the ultimate state of RBC at the investigated control parameters. (Adapted from [4].) |
Effective Reynolds number
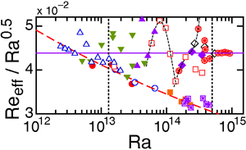
In [7] we additionally determined the effective Reynolds number, Reeff of the Γ = 0.50 cell based on local temperature time series measurements. By assuming that temperature is a passive scalar and by using the elliptical approximation [8] we were able to determine Veff = √U ² + V ² and the corresponding Reeff = Veff L/ν. Here, U is the time-averaged vertical velocity component, V is the root-mean-square of the velocity fluctuations and ν is the kinematic viscosity. Our data showed that Reeff is dominated by the contribution in V. Furthermore, we examined the local effective scaling, Reeff ∝ Raζeff (see figure 2). For Ra ≤ Ra*1 ≃ 1.5×10¹³, the results are consistent with expectations for classical RBC [1, 9]. For Ra ≥ Ra*2 ≃ 5×10¹⁴, the data matches well with a pure power law with an exponent of 1/2 and no logarithmic corrections as predicted by Grossmann and Lohse [1]. For the range Ra*1 < Ra < Ra*2 complex behavior associated with the transition from the classical to the ultimate state was observed for Reeff, analogously to Nu. In this range the Reeff values correspond to estimated shear Reynolds numbers ranging from about 200 to 400. These values are consistent with the expected transition to turbulent BLs in shear flows. Thus, the Reeff results also support our view that we have found and characterized the transition to the ultimate (asymptotic) state of RBC.

|
Figure 2: The effective Reynolds number Reeff of the Γ = 0.50 cell, compensated for by Ra0.5. Different symbols indicate different pressures and different mean temperatures and thus different Ra ranges. The vertical dashed lines indicate Ra*1 and Ra*2, identical to as shown in figure 1. At Ra ≥ Ra*2 ≃ 5×10¹⁴, the data show a clear scaling of Reeff ∝ Ra0.5, as predicted by [1] to be inherent to the ultimate state of RBC. (Adapted from [7].) |
Logarithmic temperature profiles
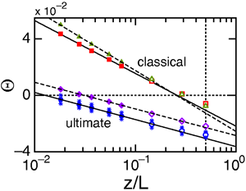
For both the classical and the ultimate state, we found by experiment [10] that beyond a thin BL or thermal sublayer the temperature T(z) and its root-mean-square fluctuation vary logarithmically as a function of the distance z from the bottom plate. Specifically, the temperature T(z) can be fitted well by the function Θ(z) = A × ln(z/L) + B, as is shown in figure 3. Here, Θ is the deviation of the local temperature from the sample mean temperature, scaled by the applied temperature difference. For the classical state at Ra ≤ 2×10¹², these results were confirmed and extended by direct numerical simulation. To our knowledge there is no theory at present that predicts a logarithmic temperature profile in the bulk for Ra < Ra*1. For the ultimate state at Ra > Ra*2 these findings agree with the logarithmic dependence predicted by [1] as a result of the BLs having transitioned into turbulence and extending vertically throughout the entire sample. Thus, there is no 'bulk' in the same sense as there is for the classical state.

|
Figure 3: The non-dimensional temperature Θ plotted as function of the vertical height z/L. Here, the symbols indicate the measured data obtained from the Γ = 0.50 cell and the vertical dotted line is the middle height of the cell. In both the classical and the ultimate state, the vertical temperature profiles can be described well by logarithmic fits, shown as the sloping lines. We believe that this discovery is an important step towards developing a more fundamental understanding of the bulk. (Adapted from [10].) |
References
[1] S. Grossmann, and D. Lohse, Phys. Fluids 23, 045108 (2011)
[2] R.H. Kraichnan, Phys. Fluids 5, 1374 (1962)
[3] X. He, D. Funfschilling, H. Nobach, E. Bodenschatz, and G. Ahlers, Phys. Rev. Lett. 110, 199401 (2013)
[4] G. Ahlers, X. He, D. Funfschilling, and E. Bodenschatz, New J. Phys. 14, 103012 (2012)
[5] X. He, D. Funfschilling, E. Bodenschatz, and G. Ahlers, New J. Phys. 14, 063030 (2012)
[6] G. Ahlers, D. Funfschilling and E. Bodenschatz, New J. Phys. 11, 123001 (2009)
[7] X. He, D. Funfschilling, H. Nobach, E. Bodenschatz, and G. Ahlers, Phys. Rev. Lett. 108, 024502 (2012)
[8] G.W. He, and J.B. Zhang, Phys. Rev. E 73, 055303 (2006)
[9] G. Ahlers, S. Grossmann, and D. Lohse, Rev. Mod. Phys. 81, 503 (2009)
[10] G. Ahlers, E. Bodenschatz, D. Funfschilling, S. Grossmann, X. He, D. Lohse, R.J.A.M. Stevens, and R. Verzicco, Phys. Rev. Lett. 109, 114501 (2012)


