
Manfred Faubel

Spektroskopie wässriger Oberflächen
Scientist
Sitemap
Introduction
Studies of aqueous solution surfaces open up the vast field of available atomic and molecular physics and of surface science technology for new approaches to 'real' chemical aqueous solutions and of biologically interesting liquids at the molecular and atomic electron state experimental level. The experimental complication that must be overcome here is caused by the high vapor pressure of liquid water of as high as 6.1 mbar at 0 °C, and makes the liquid water non-compatible with vacuum requirements.
Molecular beam design considerations of the evaporating liquid water surface suggest that a free vacuum surface without collisions of emerging molecules in the vapor-phase can be obtained for very small liquid areas with spatial extensions smaller than the molecular-mean-free-path in the vapor. This is in the order of 10 μm for a neat water surface, only, and requires micromechanical construction of this part of liquid water surface experiments.
The rapid evaporative cooling of the liquid sample by unilateral free vacuum flow of the sonic speed vapor poses a further experimental problem and is compensated by using a fast flowing very thin cylindrical liquid jet with a few micrometer diameter and flow speeds of 100 m/s. The evaporative cooling in vacuum is here lowering the aqueous surface temperature by less than 5 °C on the experimental point of surface observation at one or two mm downstream of the liquid water jet. An additional advantage of the flowing liquid jet technique is a steady renewal of the liquid surface at a surface exposure rate of 10 μs on 1 mm jet length. This is important because ultra clean liquid surfaces can be produced with moderate high vacuum requirements of 1 mPa.
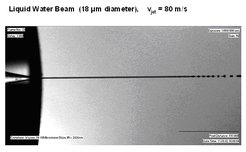
Figure 1 shows a high speed photograph of a typical microjet with 50 ns exposure time. The initially cylindrical jet with a very smooth surface is emerging from a 18 µm diameter nozzle from a 80 bar pressure reservoir. It is decaying spontaneously after several hundred jet diameters into a stream of droplets at follow- up frequencies of approximately 1 MHz.
Photoelectron spectroscopy of solvate states in liquid water
The electronic binding energy of individual atomic or molecular electron states or electronic bands in condensed molecules is experimentally accessible in the kinetic energy spectrum of photoelectrons emitted by high energy photons. The energy Ekin of a peak in the photoelectron spectrum is related to the bound electron state energy EBin and to the photon energy hν by the well known, just 100 years old, Einstein relation EBin = hν - Ekin.
In addition, the atomic or molecular density of molecules in a liquid solution can be determined by an intensity measurement of the atom-specific photoelectron emission lines and has a surface layer probing depth of approximately 0.5 nm.
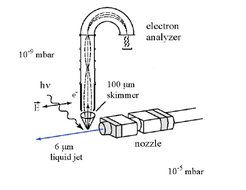
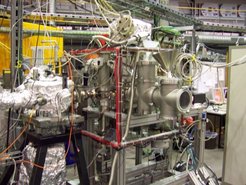
The photoelectron spectra can be measured by deflecting the emitted photoelectrons in well defined electrostatic fields in a collision free ultrahigh vacuum. Photoelectron spectroscopy, therefore, requires high vacuum conditions at the liquid water surface. Because the experimental free vacuum surface of liquid water can be only a few 10 μm wide, a photon source with high brilliance is required which became available only recently with modern synchrotron photon sources in the energy range of interest, between 15 eV < hν < 150 eV. The principal setup scheme for the liquid water jet photoelectron spectroscopy is further illustrated by the sketch shown in Figure 2, while a photograph of the whole vacuum apparatus, as operated on a Bessy synchrotron beamline in Berlin is seen in Figure 3.
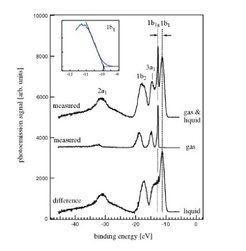
An example for a synchrotron radiation photoelectron spectrum measurement for neat liquid water is shown in Figure 4. The first spectrum (Fig. 4a) shows a the spectrum on the free vacuum liquid jet, which is composed of the liquid water surface spectrum and of a contribution from the water vapour cloud evaporating from the room temperature liquid jet. A pure vapour phase spectrum is measured separately, in Fig. 4b. It shows the known energy spectrum for the four different valence bond electron levels of the H2O molecule. In the difference spectrum (Fig.4c) the pure liquid water spectrum is obtained. The liquid phase spectrum exhibits a considerable broadening of the four principal orbitals by the inhomogeneous molecular environment of the liquid water. In addition, the average liquid ionization peak energies are lowered by 1.6 to 1.9 eV with respect to the gas phase, which is theoretically understood as a consequence of the condensed phase surroundings.
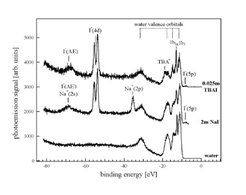
A more complex case for salt ion solvation in liquid water is studied in Figure 5 by photoelectron spectra (from bottom to top) on pure water, on a 2 mol solution of NaI, and for a 0.25 mol solution of the surface active tetra-butyl-ammonium iodide salt (TBAI). The latter is surface enriched by a factor of 80 as compared to the iodine in the 'normal' salt aqueous NaI solution, showing a very strong enhancement of the I- anion photoelectron peak intensity in relation to the absolute salt concentration.
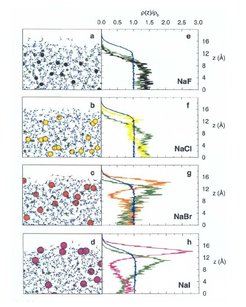
Surface enrichment of solvate negative halogen ions was recently also investigated in an oceanographic context and is understood by new molecular computer simulations of liquid aqueous salt solutions including ion polarizability contributions to intermolecular forces in electrolyte solutions by Jungwirth. An example for the computed salt ion distribution near the surface of a simulated liquid slab is given in Figure 6 for several emulated alkali-halide aqueous solution systems.
Work in collaboration with: B. Winter, I. Hertel (MBI-Berlin), C. Pettenkoffer (HMI-Berlin), P. Jungwirth (Prague), S. Bradforth (U.Southern California). B. Winter is now at Helmholtz Zentrum Berlin/BESSY.
Mass spectrometry of protein solvate ions at aqueous solution surfaces
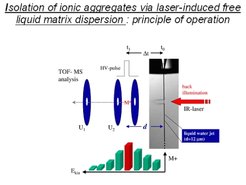
The liquid water jets in vacuum provide also a convenient experimental link to the mass spectrometry of large molecules, which can not be evaporated into vacuum without undergoing pyrolysis or fractionate in electron beam ionizers. This is an analytical problem in particular for peptides and proteins or for DNA nucleotide fragments. These very large bio-molecules solvate reasonably well as ions in aqueous liquid solution, and, can be laser-desorbed from the liquid aqueous microjet surface into vacuum, as was established by Brutschy, a decade ago. The desorption mechanism is still not yet completely understood. In this process, as illustrated in Figure 7, a infrared laser pulse with approximately 10 ns pulse length irradiates the liquid microjet with a power density of 108 to 109 W/cm2. The laser wavelength is tuned to the absorption maximum of water near 2.8 µm, and leads to the instant heating of the illuminated liquid volume to temperatures above 500 °C and to high pressure shock waves, expanding through the superheated liquid volume. As a result, a fraction of the solvated ions are ejected from the liquid surface without having had enough time to recombine with their counter-ions and can be extracted for mass analysis into a high resolution 'reflectron'-type mass spectrometer.
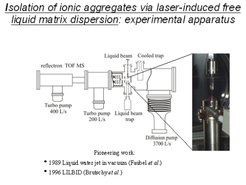
The recently developed laser ion desorption liquid beam apparatus is shown in further detail in Figure 8. The liquid microjet is passing through the source vacuum chamber from top to bottom. The jet is produced by a glass nozzle. It is leaving the main vacuum chamber through a 'reverse molecular beam skimmer' with narrow aperture, and can be collected as a liquid in a glass container on the bottom side of the high vacuum apparatus. The laser evaporated ions are accelerated by high voltage pulses toward the mass spectrometer, shown in the left hand part of the apparatus with supplementary high vacuum turbo-molecular pumps.
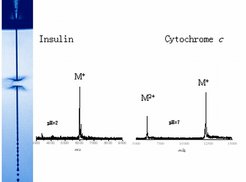
Two representative 'analytical laser liquid desorption ion' mass spectra of slute proteins are shown in Figure 9 for insulin (9a) with a molecular weight near 6000 Dalton and for cytochrome-c with a mass near 12 kDalton (9b). An almost pure monomer mass spectrum for Insulin singly charged ions is obtained from a pH 2 acidic aqueous solution of insulin, while a cytochrome-c solution at pH 7 under laser irradiation is emitting, both, singly charged and doubly protonated cytochrom molecules, in accordance with the higher proton association probabilities for an increasing number of association sites on these larger molecules. Ion desorption mass spectra were found in several cases to scale linearly with the solute protein concentration over concentration ranges of two to three orders of magnitude. This could make the laser desorption mass spectrometry to a reliable quantitative tool for direct analysis of natural liquid solutions, competing only with the two established MALDI- and ESI-ionisation techniques which had been granted with the chemistry Nobel Award, in 2002.
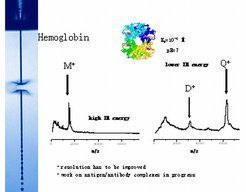
Another example for a protein with a known tendency of forming weakly bound tetramer aggregates in aqueous solution is hemoglobine, with laser desorption mass spectra shown in Figure 10 for two different laser intensities. For a higher laser pulse energy the hemoglobine monomer dominates the desorbed protein in mass spectrum (Fig 10a). For somewhat lower laser energy deposition and somewhat less violent desorption conditions in the liquid solution, stronger dimer peaks and tetramer peaks appear at the doubled and quadrupled hemoglobine molecular masses near 31 kDalton and near 62 kDalton, respectively.
Work in collaboration with: B. Abel and his group (U. Göttingen and MPI for biopysical chemistry, now U. Leipzig).


